


Efficient Power Measurement and Analysis, Part 1
Source: Probemart 2026-06-26 Views: 172
Preparing for power measurements
To make accurate measurements, the power measurement system must be set up correctly, waveforms must be captured accurately, and analysis and debugging must be performed. Important topics to consider include:
■ Eliminating the time delay between the voltage probe and the current probe
■ Eliminating probe offset
■ Degaussing the current probe
Eliminating the time delay between the voltage probe and the current probe
When making power measurements with an oscilloscope, it is necessary to measure the voltage across the device under test and the current through the device under test. This task requires two separate probes: a voltage probe (typically a high-voltage differential probe) and a current probe.Each voltage probe and current probe has its own propagation delay characteristics, and the edges produced in these waveforms may not be aligned. The difference in delay between the current probe and the voltage probe is called the time delay and leads to inaccurate amplitude and timing measurements.
Because the time delay produces a timing delay, it causes inaccurate timing difference, phase, and power factor measurements. Many measurement systems can“automatically calibrate”the internal delay of the instrument, but when probes are added to the system, differences in probe amplifier and cable length must be compensated.
Tektronix4SeriesB MSOcan compensate for the delay from the probe tip to the measurement system, ensuring the most accurate timing measurements. You can manually correct the probe time delay by connecting the probes to the same waveform source and then adding delay to the signal path of the faster signal, so that the signals are aligned in time without physically adding cable length to the shorter probe cable.

Figure 1 Perform static compensation of the time delay between the differential voltage probe and the current probe before adjustment. These probes have onboard memory that stores the nominal propagation delay.
4SeriesB MSOalso provides one-button“static”deskew function.Figure1is an example of skew between twoTekVPI®power probes.The oscilloscope reads the nominal propagation delay from the probes and calculates the delay difference between the two probes to be approximately1.48ns. You only need to pressOK,Deskewbutton to adjust the relative timing between the signals.
Figure2shows, for the same test setup used in Figure,1the result after running the static deskew function.If a non-Tektronix probe is used, you need to manually deskew the voltage and current waveforms and configure the current probe settings.

Figure 2 Static deskew compensation after adjustment. Note that, based on the propagation delay stored in the probe, it has already been increased-1.48 nsdeskew calibration
Remove probe offset
A differential probe may have a very small voltage offset. This offset may affect accuracy; the offset should be removed before continuing the measurement. Most differential voltage probes have a built-inDCoffset adjustment control, so removing the offset is relatively simple.
Similarly, the offset on the current probe must first be adjusted before measurement can be performed. ByDCzeroing the current to0Athe median value or as close as possible to0A, the current probe offset can be adjusted.TekVPIprobes, such as theTCP0030AAC/DCcurrent probe, have a built-in automatic Degauss / AutoZero(degauss / auto-zero) procedure; simply press the button on the probe compensation box to complete the operation, as shown in the figure3as shown.
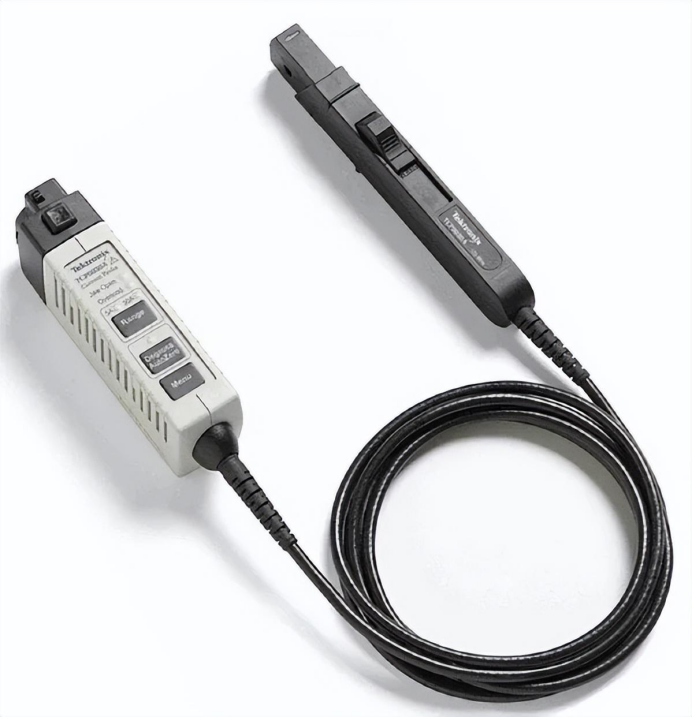
Figure 3 Tektronix TCP0030A AC/DC current probe has Degauss/AutoZero( degauss, / auto-zero) ) function
Degauss the current probe
The degauss function removes, in the transformer core, any residualDCflux, which may be caused by a large input current. This residual flux causes offset error; this error should be eliminated to improve measurement accuracy.
TektronixTekVPIThe current probe provides a degauss warning indicator that warns the user to perform a degauss operation. The degauss warning indicator is very important because current probes drift over time, which can significantly affect measurements.

Figure 4 Many power supply topologies require measuring small differential voltages in the presence of large common-mode signals. For example, in a half-bridge switching circuit, the high-side switch'sVGSandVDStypically swings hundreds or thousands of volts above and below ground level.IsoVuTMThe isolated measurement system can be used with4seriesB MSOin combination to provide ultra-high common-mode rejection.
Solving wide-bandgap testing challenges
Until now, switching measurements on the high-side switch of a half-bridge switching circuit have been almost impossible to achieve. Any measurement referenced to the switching node, including high-sideVDSand the voltage across the current shunt device are subject to distortion caused by a significant common-mode voltage signal impinging on the differential signal. This problem becomes even more severe in wide-bandgap devices such asGaNandSiCtransistors, because the switching frequency has increased and entirely new designs must be optimized.IsoVuThe probe's excellent common-mode rejection and advanced power measurement and analysis automation capabilities enable optimization of the latestGaNandSiCThe design provides an effective solution.
Input analysis
Line-frequency measurements characterize the design's response to input variations, the current and power drawn by the design, and the line-frequency current distortion of the design. Some measurements, such as power consumption, are key metrics. Other measurements, such as power factor and harmonics, may be subject to regulatory limits.
Power quality measurements
In4/5/6-PWR, power quality measurements are a standard set of power measurements. They are typically performed onACline inputs but can also be applied to the device'sACoutputs, such as power inverters. These measurements include:
■ Frequency
■ RMSVoltage and current
■ Crest factor (voltage and current)
■ Active power, reactive power, and apparent power
■ Power factor and phase
Making measurements
Power quality measurements can be made easily by using a differential probe to measure the line-frequency voltage of the system and a current probe to measure the line-frequency current of the system. The same setup can also be used to measure current harmonics.

Figure 5 Power quality measurement plots a richACline diagram. The upper waveform is the line-frequency voltage, the current is the red waveform, and the instantaneous power is the orange waveform. The results label (upper right) shows a summary of line-frequency characteristics; the results table in the upper area can be activated to provide more detailed data and statistical information
Measurement results
• Frequency: the frequency of the voltage waveform, in units ofHz
• VRMS: RMS value of the displayed voltage waveform
• IRMS: RMS value of the displayed current waveform
• Voltage crest factor: the peak amplitude of the voltage divided by the voltageRMSvalue
• Current crest factor: the peak amplitude of the current divided by the currentRMSvalue
• Active power: real power of the measured system, in watts(W)
• Reactive power: imaginary power temporarily stored in inductive or capacitive elements, expressed inVolt-Amperes-Reactive(VAR)Indicates
• Apparent power: absolute value of the measured complex power, in volt-amperes(VA)
• Power factor: ratio of active power to apparent power
• Phase: angle between active power and apparent power, in degrees
Reprinted from Tektronix

PCIM Europe 2026, Nuremberg: IWATSU and PMK at Booth H7-157
2026-06-15
APEC 2026: 41st IEEE Applied Power Electronics Conference and Exposition
2026-03-15
Semicon China 2026, Shanghai New International Expo Centre (SNIEC)
2026-03-11
WiPDA Asia 2025, Beijing International Convention Center, 15 August
2025-08-06